
In Spring Boot, adaptive timeout logic gives services a way to stay responsive while upstream traffic, cross region hops, or third party dependencies slow down for short periods. Fixed timeouts match only the traffic profile guessed at configuration time, so when latency drifts, static values either fire too early and create noisy failures or hold connections open far too long. Adaptive timeouts read live latency data, watch how long recent calls take, and adjust how long each client is willing to wait on future calls, frequently tuned per service or per endpoint. Spring Boot already ships with HTTP client abstractions and Micrometer metrics, so most of the building blocks already sit in the stack, and the remaining effort lies in connecting those parts into a feedback loop that follows real numbers instead of guesses.
How Timeouts Behave For Outbound Calls
Timeouts for outbound calls live at more than one layer. Spring Boot services that call remote HTTP endpoints usually rely on timeouts in the underlying HTTP client, in higher abstractions such as RestClient, WebClient, or Feign, and sometimes in reactive operators or circuit breakers wrapped around those calls. Those layers interact along a single call path that starts at DNS lookup and TCP connect and ends with the last byte of a response, so it helps to see where each timeout sits and what it actually limits.
Layers That Control An Outbound Timeout
Network calls pass through a few distinct phases before a response body arrives. DNS lookup maps the hostname to an address. TCP connect opens a socket, and TLS may negotiate encryption on top of that socket. After a connection is ready, the client sends HTTP request bytes, waits for response headers, and then starts reading the response body, which could be a small JSON document or a long streaming response. Connect timeouts cap how long the client waits for a TCP connection to succeed. Response or read timeouts control how long the client waits for headers or body bytes after the request has been sent and a connection exists.
Spring’s WebClient usually runs on Reactor Netty, so timeout behavior links back to Netty’s HttpClient. Connect timeout comes from ChannelOption.CONNECT_TIMEOUT_MILLIS, and the high level response window comes from responseTimeout, which caps how long the client waits between network reads while it is receiving the response. That means configuration on the Reactor Netty client controls low level socket behavior even when code only interacts with the WebClient API.
Let’s look at a WebClient bean wired to a custom Reactor Netty client:
 { HttpClient httpClient = HttpClient.create() .option(ChannelOption.CONNECT_TIMEOUT_MILLIS, 2_000) .responseTimeout(Duration.ofSeconds(5)); return builder .baseUrl(\"https://payments.internal\") .clientConnector(new ReactorClientHttpConnector(httpClient)) .build(); }")
This bean sets a two second connect timeout at the TCP layer and a five second response timeout, so any call made through paymentsWebClient will fail if the connection cannot be opened in time or if the response phase drags on too long for that service.
Synchronous HTTP calls that rely on Spring’s newer RestClient abstraction follow a different stack but a similar idea. RestClient delegates down to a ClientHttpRequestFactory, which can be backed by Apache HttpClient, Jetty, or the JDK HTTP client. Connect and read timeouts live on that request factory and propagate into the underlying HTTP library
A custom RestClient that uses Apache HttpClient with explicit timeouts can look like this.
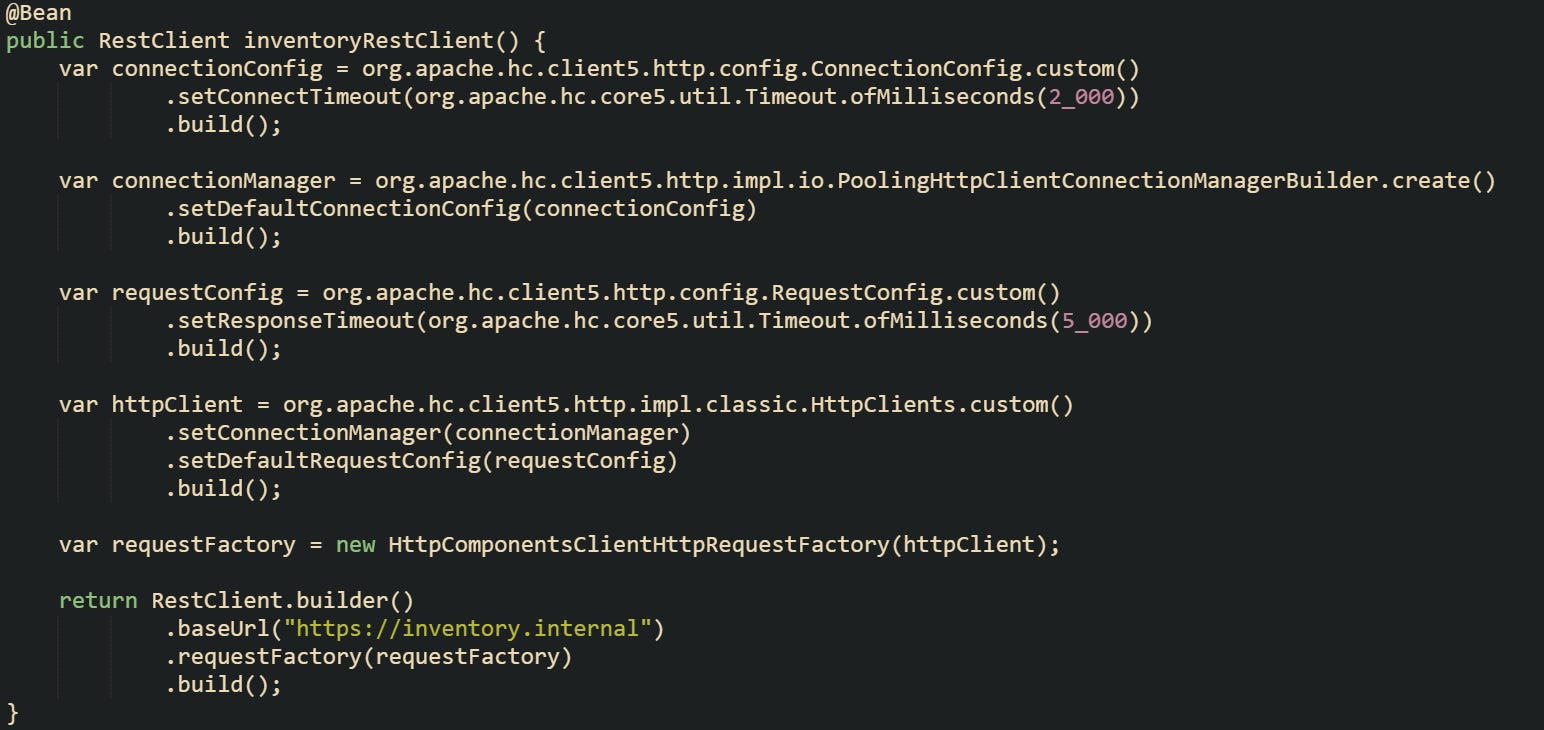
This configuration sets connection and response timeouts on Apache HttpClient through ConnectionConfig and RequestConfig, then hands that client to RestClient so calls from that bean inherit those socket limits.
Modern Spring Boot releases also expose HTTP client configuration through properties so that common timeout values can be driven from external configuration. spring.http.clients.connect-timeout and spring.http.clients.read-timeout apply to auto-configured HTTP clients, and spring.http.serviceclient.<group-name> groups allow per-service configuration, including connection and read timeouts for HTTP service interfaces built on top of RestClient. That lets timeouts move out of code in many cases and live in configuration files.
Feign clients from Spring Cloud add another layer on top of those HTTP stacks. OpenFeign defines two main timeout concepts, connectTimeout for the TCP handshake window and readTimeout for the period from connection establishment through response. Spring Cloud OpenFeign lets those values be configured per client or for a default client group.
A basic Feign configuration in application.yml can look like this:

That kind of configuration gives every Feign client a two second connect timeout and a five second read timeout unless a more specific client section overrides those numbers.
Timeouts do not stop at the HTTP client level. Reactive pipelines built around WebClient can also apply Reactor’s timeout operator to a Mono or Flux, which acts as a higher level guard for the whole call, and synchronous wrappers can apply their own time limits with blocking calls. All those layers share responsibility for how long a client waits before giving up, so any adaptive strategy has to account for the earliest limit along that chain.
Why Static Timeouts Hurt In Real Traffic
Static timeout values usually come from a mix of local testing, hand picked numbers, and a desire to feel safe about slow calls. Someone sets two seconds for an internal call and five seconds for a cross region or third party call, leaves those values in properties, and moves on. Latency in live systems moves around much more than that first guess, so those timeouts stop matching real traffic behavior.
Night traffic and daytime traffic rarely look the same. A search endpoint might answer in 150 milliseconds near midnight when only a trickle of users are online, then sit closer to 900 milliseconds during a busy daytime peak when caches, connection pools, and database backends run hotter. A caller with a fixed 500 millisecond timeout that worked during quiet integration tests will start raising timeout errors during business hours even though the upstream service still returns valid responses, just more slowly than before. That leads to noisy alert streams, frustrated callers, and pressure to keep raising timeouts without a data driven view of latency.
Static values also ignore differences between callers. One service that runs in the same Kubernetes cluster and region as its upstream partner will see low network overhead and tight latency bands. Another service that runs in a different region or even a different cloud provider will add extra hops, higher variance, and an entirely different latency profile, despite calling the same upstream endpoint. A single shared timeout number across both callers cannot reflect those differences, so one caller either times out too early or waits far longer than it needs to.
Code that hard codes timeouts tends to lock those guesses even deeper into the system. A reactive client that always uses the same timeout value gives no room for change without a new deployment.
 { return webClient.get() .uri(\"/api/customers/{id}\", id) .retrieve() .bodyToMono(CustomerProfile.class) .timeout(Duration.ofMillis(500)); }")
This call forces every profile lookup through a 500 millisecond window, whether traffic is light or heavy, and whether the caller sits in the same region or across a slow link. That single value becomes a permanent part of behavior for all environments that share this code.
Fixed configuration at the Feign level follows the same pattern. A single connectTimeout and readTimeout pair in properties treats every downstream call as identical, regardless of how latency looks in different environments or for different upstreams.

This billing client will always give up after one second for connects and two seconds for reads, even if production data shows that most calls succeed a little beyond that line or that cross region calls to the same service cluster naturally sit higher.
Timeouts applied at several layers compound these issues. A short timeout operator around a reactive pipeline can fire before HTTP client read timeouts, and HTTP client timeouts can fire before any higher level resilience components get involved. When every layer holds a fixed number that never learns from real traffic, services either fail too quickly when latency climbs or tie up resources far longer than they need to when dependency performance improves. Adaptive logic only starts to help after the behavior of these static timeouts is well understood.
Building Adaptive Timeouts In Spring Boot
Spring Boot gives a lot of pieces that already fit this problem space, even before any custom code appears. Metrics come from Micrometer, HTTP calls flow through WebClient, RestClient, or Feign, and Actuator wires those pieces into one metrics registry. Adaptive timeouts grow out of that foundation. Latency numbers land in timers, a small policy object reads those numbers and produces a timeout window, and HTTP clients consult that policy before making outbound calls so they can pick a value that reflects current conditions rather than a guess from months ago.
Capturing Latency Trends With Micrometer
Micrometer acts as the bridge between application code and metric backends. Timers are the main tool for latency tracking, because they record both how many calls occur and how long those calls take. A timer can also keep histogram data and publish percentiles, which gives a richer view of how response times spread out instead of just one average number.
Spring Boot Actuator configures a MeterRegistry and connects common components to it. HTTP client metrics for WebClient and RestClient can be turned on through properties or configuration, but nothing stops you from adding your own timers in places where those defaults do not reach. That is useful when a single service calls multiple upstreams and you want to track each one with its own metric series.
Now, let’s look at a timer bean for outbound calls to a specific service:
 { return Timer.builder(\"http.client.latency\") .description(\"Outbound latency to the catalog service\") .publishPercentiles(0.5, 0.9, 0.95) .publishPercentileHistogram() .tag(\"client\", \"catalog\") .register(registry); }")
This timer records every call that the service makes to the catalog backend and keeps enough histogram data to answer percentile questions such as p90 or p95 latency. Those percentiles can be scraped by Prometheus or a SaaS metric backend, and they can also be read from HistogramSnapshot inside the service for a local adaptive timeout policy.
Recording metrics at the call site keeps the numbers close to business logic. Reactor based code can measure duration with nanosecond precision by capturing timestamps around the call and feeding a Timer from reactive callbacks.
 { return Mono.defer(() -> { long startNanos = System.nanoTime(); return webClient.get() .uri(\"/api/catalog/{id}\", id) .retrieve() .bodyToMono(CatalogItem.class) .doFinally(signal -> { long endNanos = System.nanoTime(); catalogClientTimer.record(endNanos - startNanos, TimeUnit.NANOSECONDS); }); }); }")
This pattern lets the timer see the full time from before the HTTP call starts until the response completes or fails, not just the socket time that the client library sees internally. That end to end view is the data that an adaptive timeout policy needs, because it reflects actual experience for callers rather than just transport level timing.
Micrometer’s Timer exposes the takeSnapshot method, which returns a HistogramSnapshot with both percentile values and histogram counts. That snapshot gives a safe way to ask for percentiles without tying code to a specific backend implementation.
Deriving A Timeout From Recent Data
Latency numbers only help if they feed a decision. Adaptive timeouts need a rule that transforms a statistical view of recent calls into a single duration that callers can use for their next request. That rule can stay small and still be effective, as long as it respects three ideas. A percentile threshold such as p90 or p95 marks a boundary between typical and slow calls, a scaling factor lifts the timeout above that percentile so normal traffic does not hit it, and upper and lower bounds keep the timeout from wandering into extreme values.
A policy object that holds those rules separates timeout decisions from connection code. Callers do not need to know how timeout values are derived; they only need a current value that reacts to latency trends in a stable way.
 { this.percentile = percentile; this.floor = floor; this.ceiling = ceiling; this.currentTimeout = new AtomicReference<>(initialTimeout); } public void recomputeFrom(Timer timer) { HistogramSnapshot snapshot = timer.takeSnapshot(); for (ValueAtPercentile v : snapshot.percentileValues()) { if (Math.abs(v.percentile() - percentile) < 0.0001) { Duration pctDuration = Duration.ofNanos((long) v.value(TimeUnit.NANOSECONDS)); Duration scaled = pctDuration.multipliedBy(2); if (scaled.compareTo(floor) < 0) { scaled = floor; } if (scaled.compareTo(ceiling) > 0) { scaled = ceiling; } currentTimeout.set(scaled); break; } } } public Duration currentTimeout() { return currentTimeout.get(); } }")
This class expects a percentile such as 0.95, a floor such as 100 milliseconds, a ceiling such as 5 seconds, and a starting timeout value to use until enough data arrives to compute percentiles. The recomputeFrom method reads the timer snapshot, looks for the configured percentile, multiplies that value by two, clamps it to the floor and ceiling, and writes the result into an atomic reference. That atomic reference makes it safe for multiple threads to read the timeout while a scheduler occasionally updates it.
Scheduling the policy update on a fixed interval works well. Small Spring components with @Scheduled can call recomputeFrom every few seconds or minutes, depending on traffic volume, so long running services gradually adapt to new traffic conditions while avoiding frantic jumps based on a handful of calls.
 { this.policy = policy; this.timer = timer; } @Scheduled(fixedDelayString = \"5000\") public void refreshTimeout() { policy.recomputeFrom(timer); } }")
This refresher keeps the timeout policy supplied with up to date percentile data without adding any work to the call path itself.
Applying Adaptive Timeouts In HTTP Clients
With a policy that exposes currentTimeout, outbound clients gain a source of time limits tailored to recent latency. The job of client code is to pull the current timeout, apply it to the call, and keep recording durations into the timer so the next round of calculations stays accurate.
Reactive HTTP calls through WebClient fit naturally with adaptive timeouts because Reactor provides the timeout operator. A call can read the current timeout, apply timeout, and still record latency with a Timer.
 { this.webClient = ordersWebClient; this.timer = ordersTimer; this.policy = policy; } public Mono<OrderSummary> getOrder(String id) { return Mono.defer(() -> { long start = System.nanoTime(); Duration timeout = policy.currentTimeout(); return webClient.get() .uri(\"/api/orders/{id}\", id) .retrieve() .bodyToMono(OrderSummary.class) .timeout(timeout, Mono.error(new TimeoutException(\"adaptive timeout\"))) .doFinally(signal -> { long end = System.nanoTime(); timer.record(end - start, TimeUnit.NANOSECONDS); }); }); } }")
This client reads a timeout that already factors in percentile data and safety bounds, then applies it at the reactive level. The underlying Reactor Netty client still holds its own connect and response timeouts, which should be configured to sit at or above the highest adaptive timeout you expect for this service. That way, the adaptive guard usually fires first, and transport timeouts act as a safety net rather than the primary control.
Synchronous code built on RestClient can also work with adaptive timeouts, although the mechanics differ. Per call configuration can be achieved by building a short lived RestClient with a custom ClientHttpRequestFactory carrying the timeout for that call. That pattern makes sense for services that rely on blocking I/O but still want timeouts that follow latency trends.
 { this.policy = policy; } public Invoice fetchInvoice(String id) { Duration timeout = policy.currentTimeout(); var connectionConfig = org.apache.hc.client5.http.config.ConnectionConfig.custom() .setConnectTimeout(org.apache.hc.core5.util.Timeout.ofMilliseconds(timeout.toMillis())) .build(); var connectionManager = org.apache.hc.client5.http.impl.io.PoolingHttpClientConnectionManagerBuilder.create() .setDefaultConnectionConfig(connectionConfig) .build(); var requestConfig = org.apache.hc.client5.http.config.RequestConfig.custom() .setResponseTimeout(org.apache.hc.core5.util.Timeout.ofMilliseconds(timeout.toMillis())) .build(); var httpClient = org.apache.hc.client5.http.impl.classic.HttpClients.custom() .setConnectionManager(connectionManager) .setDefaultRequestConfig(requestConfig) .build(); var requestFactory = new HttpComponentsClientHttpRequestFactory(httpClient); RestClient client = RestClient.builder() .baseUrl(\"https://billing.internal\") .requestFactory(requestFactory) .build(); return client.get() .uri(\"/api/invoices/{id}\", id) .retrieve() .body(Invoice.class); } }")
This method rebuilds the HTTP client per call so that connect and response timeouts equal the current adaptive timeout, then issues the blocking RestClient call. That structure trades some allocation overhead for a tight coupling between timeout values and current latency statistics, which can be acceptable for low to moderate request volumes or for services where billing calls are not on the hottest paths.
Reactive and blocking clients both follow the same core idea. A Micrometer Timer records every outbound call, a policy object turns timer snapshots into current timeout durations, and client code reads that duration right before issuing a call so that each request sees a timeout that tracks the real performance of its upstream.
Conclusion
Adaptive timeouts tie the mechanics of Spring Boot clients to live latency data, so time limits grow out of what Micrometer timers record instead of guesses in configuration. With timers capturing every outbound call, a small policy turns percentile snapshots into a moving timeout window that HTTP clients can read right before they send a request. Reactive and blocking callers both follow this flow, which keeps timeout behavior aligned with real DNS, TCP, and HTTP timings rather than static numbers picked on day one.