

Go Testing Benchmarks and How They Are Measured


Performance testing in Go has a dedicated place in the language through its built-in benchmarking tools. These tools are designed to measure how long certain operations take and how much memory they use, all from inside the same testing framework used for unit tests. Instead of manually writing timers and logging results, developers can write a benchmark function and let the Go tooling handle the iteration count, measurement accuracy, and reporting. The process is designed so that the same benchmark code can run on different machines or Go versions while still producing results that can be compared in a meaningful way.
How Benchmark Tests Are Structured in Go
Go benchmarks live inside the same *_test.go files as regular tests, but they follow their own naming rules so the test runner can spot them. The function name has to start with Benchmark and take a pointer to testing.B as its only argument. From there, the work to be measured is placed in a loop that runs b.N times. This is more than a convention, the Go tool raises b.N until the total run meets the target -benchtime (1s by default), then reports the per-op timing. That means a developer writes the loop once, but it might run hundreds, thousands, or even millions of times depending on how fast the operation is.
Here’s a basic benchmark that tests the time it takes to create and append to a slice:

When run with go test -bench=. the output will show how many iterations the runner settled on, along with the average time per iteration. From a developer’s perspective, it’s a minimal amount of boilerplate, but the behavior is tightly controlled by the testing framework to keep results meaningful.
How the Loop and b.N Work Together
The loop and b.N control how long the run lasts. The first time the benchmark runs, b.N starts small. The runner measures the total time taken for those iterations, then scales b.N upward to increase the total measured duration. By lengthening the run, the framework reduces the impact of random fluctuations like CPU context switches or background processes. The end goal is to make the timing accurate enough that it’s not thrown off by minor system noise.
For instance, if a benchmarked operation is extremely quick, such as checking the length of a slice, a tiny b.N would produce unstable results because a few nanoseconds of interruption could shift the average. By pushing b.N high enough, those interruptions become almost negligible in the final average.
Here’s another example that measures the cost of converting an integer to a string:

The runner can quickly jump from small b.N values to a much larger value to reach the target -benchtime. The exact path it takes can vary between machines and even between runs on the same machine, depending on system load at the time.
The fact that the loop is just normal Go code also means that anything outside of it, such as allocation of input data or preparation work, should be moved before the loop or wrapped between b.ResetTimer() calls so the timing only measures what you want.
How Memory Allocations Are Tracked
Go’s benchmark framework can track memory usage along with execution time, giving a deeper picture of performance. By calling b.ReportAllocs() inside the benchmark, the output will include bytes allocated per operation and the average number of allocations. This is possible because the runtime maintains counters for allocations and deallocations that the testing package can read before and after a run.
Here’s a short example that intentionally allocates memory in each iteration:

When this benchmark runs, the output will show time per operation and about 512 B/op with 1 alloc/op per iteration.
Allocation tracking isn’t limited to obviously memory-heavy operations. It can also reveal hidden allocations that might not be obvious in the code. For example, certain map operations or string manipulations can trigger allocations behind the scenes.

For this, the map lookups themselves don’t allocate, but the string concatenation does. The allocation report will make that clear, which is helpful for performance tuning when both time and memory behavior matter.
How Go Measures Benchmark Performance
Running a benchmark in Go is more than looping through code and timing it. The testing framework controls the process from start to finish, adjusting the number of iterations, tracking elapsed time, and collecting optional allocation data. These runs are designed to be repeatable and meaningful, whether the operation takes nanoseconds or much longer. The process involves careful timing, steps to reduce outside interference, and support for running work in parallel when measuring concurrent performance.
Timing Mechanism
The benchmark runner measures elapsed time with high-resolution timers from the time package. On most platforms, this calls into system-specific functions that provide precise monotonic time values. Monotonic time matters here because it always moves forward independently of wall-clock adjustments, avoiding problems if the system clock changes during a run.
When a benchmark run begins, the runner starts timing with a monotonic clock and resets its counters. Benchmarks can use b.StartTimer(), b.StopTimer(), and b.ResetTimer() to control what gets timed. The framework times the entire BenchmarkXxx function body unless you pause or reset the timer yourself, so put any setup before a b.ResetTimer() if you want it excluded. That number is divided by the iteration count to get the average time per operation. This loop repeats with different b.N values until the total run time meets the target -benchtime, then the runner reports the results.
Here’s a benchmark that measures the time to uppercase a string:
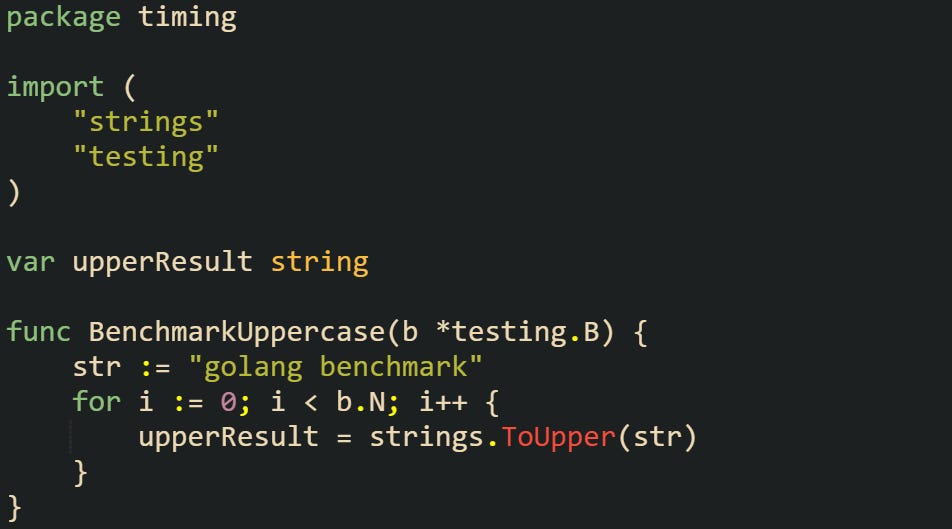
This helps keep the average time figure meaningful when comparing against other code.
Controlling Garbage Collection Impact
The garbage collector can affect benchmark results if it runs during timing. While Go’s GC keeps pauses short, it still uses CPU cycles and can nudge numbers. You can control timing and counters by calling b.ResetTimer() just before the measured loop to clear elapsed time and allocation data, and runtime.GC() to move a pending collection outside the timed region. The benchmark runner already performs a GC before each test to clear garbage from earlier runs, and you can also start or stop the timer yourself if setup work shouldn’t be counted.
Here’s a short example showing both in action:

The call to runtime.GC() happens before the timer is reset, so the collection won’t be counted in the timed loop. This is helpful when you want to measure the cost of allocations without the results being affected by unrelated GC work.
Another common pattern is doing one-time setup outside the measured loop, such as preparing large data structures, and then resetting the timer before the actual benchmark run begins.
Parallel Benchmarks
Go’s benchmark framework can measure how code performs with multiple goroutines running at the same time. This is done with b.RunParallel(), which starts a pool of worker goroutines. Each worker runs the benchmarked operation repeatedly until the total number of iterations across all workers reaches the target count.
The framework sizes the worker pool based on the current GOMAXPROCS value, and the -cpu flag sets the GOMAXPROCS values the runner will use for the benchmark. The measurement reflects combined throughput, giving a view of how the operation scales with concurrency.
Here’s an example that measures the performance of writing to a channel with multiple goroutines:

The workers all share the same channel, so performance numbers will include the cost of synchronization between senders. That’s useful when the goal is to measure behavior under a concurrent workload rather than isolated single-thread speed. Parallel benchmarks aren’t limited to channels. They can measure concurrent map operations (with proper synchronization), network request handling, or any task that benefits from being tested with simultaneous load.
How Output Is Formatted
The output from a benchmark run is concise but carries several pieces of information in one line. It starts with the benchmark name, followed by a dash and the GOMAXPROCS value used for that run. Then comes the iteration count, the average time per iteration, and optional allocation data if b.ReportAllocs() was called.
A benchmark output will look something like this:

This means BenchmarkUppercase ran with GOMAXPROCS=8 (eight logical CPUs), completed ten million iterations, and averaged 120 nanoseconds per iteration.
When allocation reporting is enabled, two more values appear:

This shows that each operation took 550 nanoseconds, allocated 512 bytes, and performed one allocation. Having all this in a single line makes it easy to compare runs without digging through large log files.
Conclusion
Go’s benchmarking system works by combining precise time measurement, dynamic iteration scaling, and optional allocation tracking into a process that’s both repeatable and adaptable to different workloads. The testing package takes care of running the code enough times to smooth out noise from the operating system or hardware, while still giving developers control over what’s measured through functions like b.ResetTimer() and b.ReportAllocs(). Parallel benchmarks add another dimension, letting you see how code behaves when multiple goroutines share the work. Together, these mechanics make it possible to measure execution speed and memory behavior with confidence, while keeping the benchmark code itself minimal and focused on the task at hand.