Working with JavaScript's PerformanceObserver to Track Web Vitals
See what the browser sees and catch layout shifts as they happen

Web pages often look like they’re working fine on the surface, but things like layout shifts, long tasks, and blocked rendering can quietly make a site slow or frustrating to use. To figure out what’s happening, developers can turn to the browser’s performance monitoring tools. One of the most powerful and modern tools available is the PerformanceObserver API. Most Chromium-based browsers and Safari 17+ support PerformanceObserver, and they can stream entry types like layout-shift and longtask directly as they occur. This lets you track layout shifts, long tasks, and other web vitals directly, without setting up polling or timers. It's part of the same performance measurement system that powers Chrome’s Lighthouse and Core Web Vitals.
Observing Web Vitals With PerformanceObserver
You can subscribe to layout shifts, long tasks, and other web vitals in real time. The PerformanceObserver lets you tap into the browser’s timeline system while the page is still running. That means you can monitor rendering problems or responsiveness without waiting until after the page is finished loading. As long as you know what you’re listening for, you’ll get a stream of detailed measurements that reflect what users are actually seeing and experiencing.
What PerformanceObserver Does
The PerformanceObserver API connects you directly to what the browser tracks internally. It watches for specific types of performance entries that are logged into the browser’s timeline. These include paints, layout shifts, long tasks, and more.
Each performance entry tells a story. A layout shift entry logs how much the screen jumped unexpectedly. A long task entry records how long the main thread was blocked by something that took too long to finish. These are not guesses or averages. The numbers come from what really happened inside the rendering engine. Performance entries have fields like startTime, duration, and entryType, and they’re grouped into categories. You can ask for just the types you want, and the browser will deliver them to your observer callback as they occur.
For example, if you care about layout stability, you can observe only layout-shift entries. If you’re focused on responsiveness, you can focus on longtask.
The system works in the background without polling. It’s passive but always watching. You can add or remove observers at any time.
Creating a Basic Observer
Here’s a basic observer to log layout shift values. The observer listens for a type, and the callback runs every time new entries of that type are available.
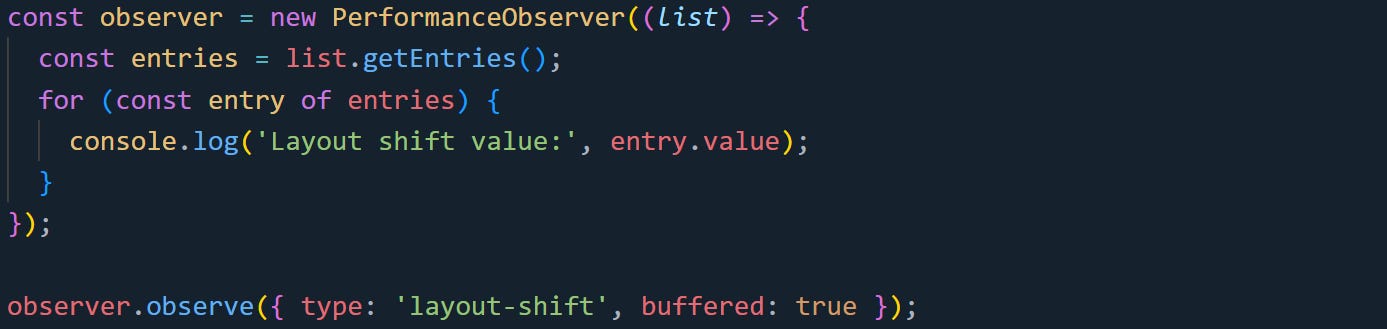
The observer object watches for layout-shift events. Using buffered: true tells the browser to include any events that already happened before the observer was attached. That’s useful if your script runs a little late or waits on user input before starting. The callback gets a PerformanceObserverEntryList. Calling getEntries() returns the actual list of events that matched. Each entry will include timing and context info specific to its type.
This version logs all layout shift values, but you can fine-tune it to filter out the noise.
Watching Layout Shifts
Layout shifts are sudden movements of elements after a page appears to have settled. These shifts usually happen when resources load in late or when dynamic content pushes things around. The browser tracks these and calculates a layout shift score, which feeds into the Cumulative Layout Shift (CLS) metric.
The layout-shift entry has a few helpful fields. The value shows how large the shift was, and hadRecentInput tells you if it occurred within about 500 ms of a tap, click, or keypress.
To avoid counting user-triggered movements, you can filter them out:
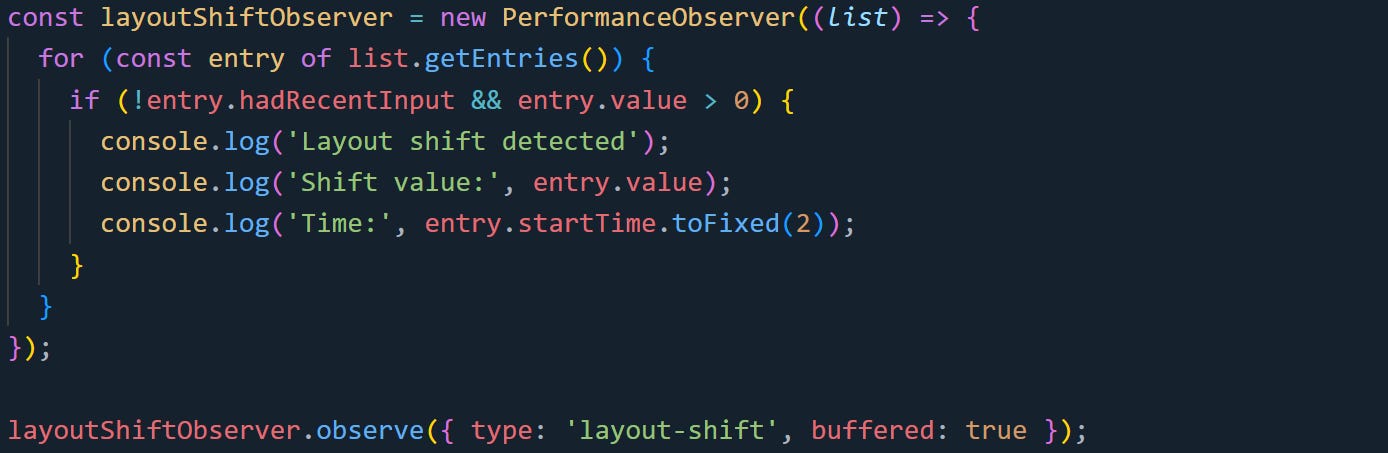
This version skips shifts that happened right after a tap, click, or keypress. Those moves are usually user-initiated, so ignoring them keeps your CLS number focused on unexpected jumps. The startTime helps you map the shift to what was happening on the page. If you’re debugging visual instability, knowing when the shift occurred can point you toward the cause. You can also look at entry.sources to get more context about which DOM elements were involved, if your browser supports that field.
Tracking Long Tasks
The longtask entry type is supported in Chromium, Samsung Internet, and Opera. It flags any JavaScript that blocks the main thread for 50 milliseconds or more. That includes functions, events, and rendering work that takes too long. These tasks delay everything else: input handling, layout updates, and even paint.
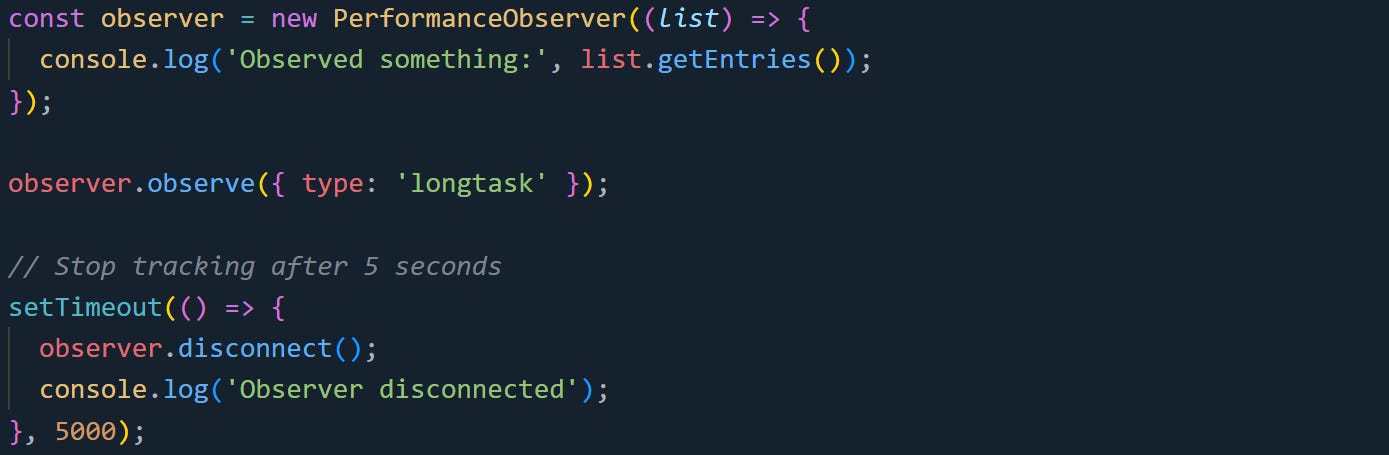
To track long tasks, set up an observer like this:
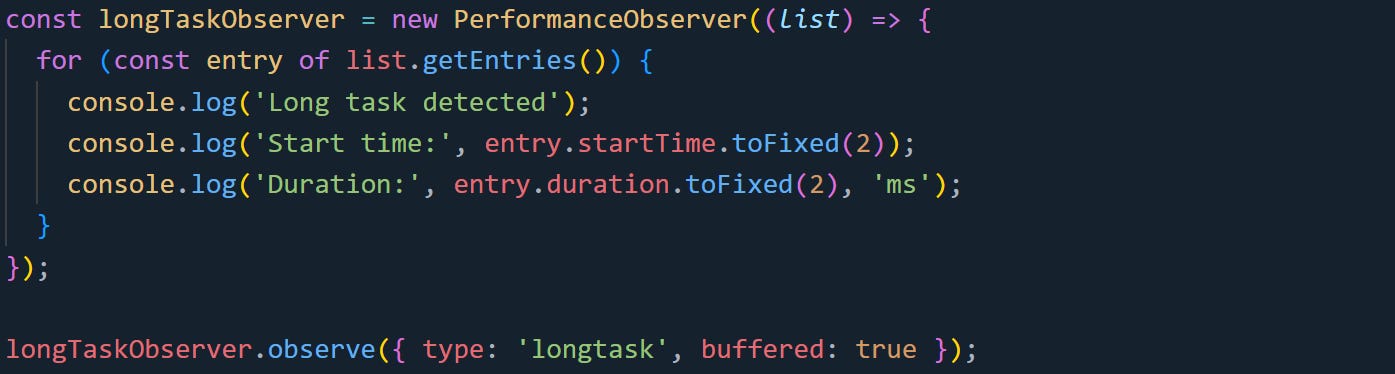
Each longtask entry includes a duration field, which tells you how long the task ran. It also includes a startTime, so you can match it to what was happening in your app around that moment.
Long tasks often point to areas in your code that need to be split up or deferred. They’re a signal that too much work is happening on the main thread all at once.
Here’s an example of a long task in action:
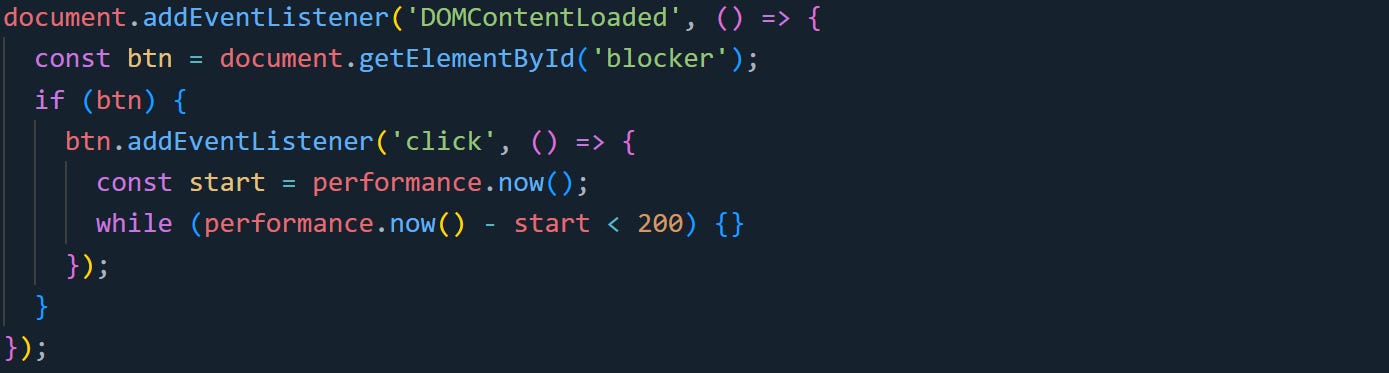
Clicking that element will freeze the page for 200 milliseconds. Your observer will catch it and log the delay.
Using Multiple Observers
You can use separate observers for different metrics or combine them into one. Both patterns are valid. A single observer can track more than one type by calling observe() multiple times.
Here’s a combined version:
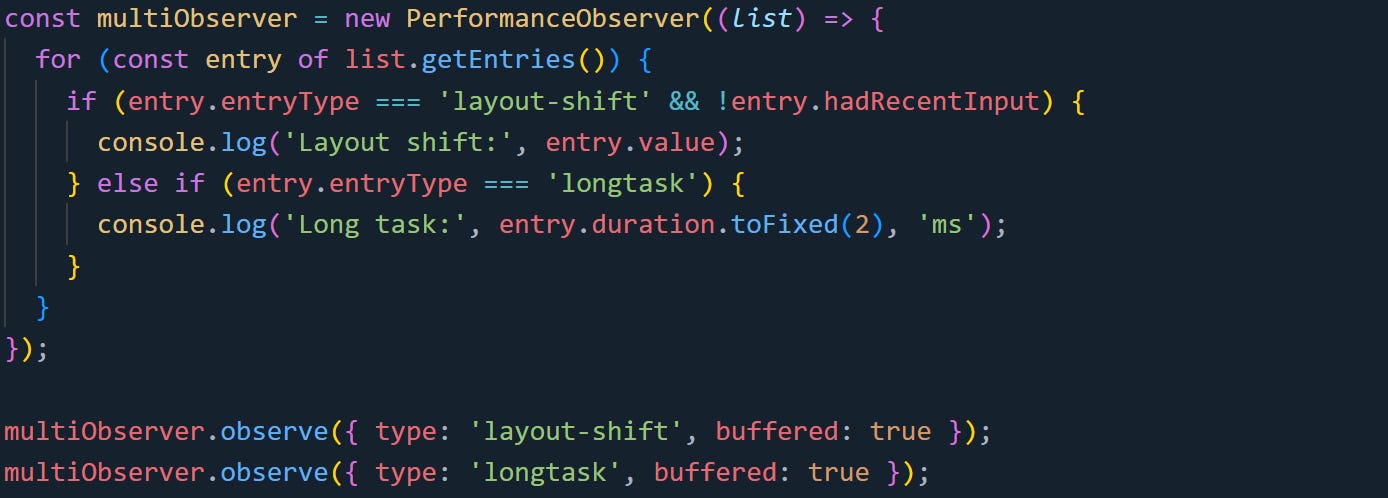
This lets you process layout shifts and long tasks in a single callback. It also helps reduce duplication when you’re collecting or logging metrics in the same place. You’re not limited to two types, you can observe as many as you need, and each type will come through with its own structure. The browser will call your callback anytime new matching entries appear.
This pattern is great for when you are tracking general performance or writing to a centralized logger. It keeps the event handling in one spot and makes it easier to correlate timings across different types of behavior.
How the Mechanics Work Behind the Scenes
PerformanceObserver runs on top of the browser’s internal performance timeline system. This isn’t just a listener tacked onto your app. It’s wired into how the browser schedules and records tasks during a page's life cycle. That’s what makes it so efficient. When you register an observer, you're tapping into events that already exist inside the rendering pipeline.
There’s no manual polling or scanning, the browser pushes entries to you. You’re not measuring performance with your own timers. You’re reading what the browser already saw and logged.
The Browser’s Event Queue and Timings
Every time the browser handles a script, lays something out, paints pixels, or responds to an event, it schedules the work on its main event loop. Most of this activity happens on the main thread, where JavaScript, rendering, and input processing all share the same space. If one job takes too long, the rest of the work has to wait its turn. To track this, the browser logs a wide range of performance entries into a timeline buffer. Each entry represents something that happened during the page’s lifetime. It includes when it started, how long it lasted, and what kind of thing it was.
PerformanceObserver is connected to that buffer. The browser triggers your callback with a batch of new entries after the current task finishes. This avoids blocking and keeps your app responsive.
Here’s a practical example that shows when the observer runs in relation to a long task:
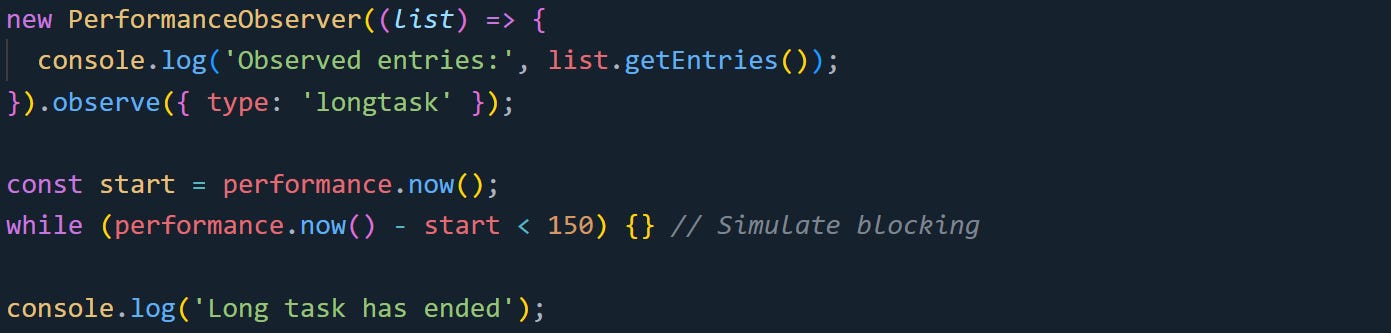
The observer callback won’t fire until the loop is free. The long task blocks the thread, so the callback waits until after it ends. That’s part of how the timing system stays accurate. It measures delays without interrupting the task itself. If you’re debugging long tasks or layout shifts, the startTime and duration fields help you pinpoint the exact moment when something slowed the browser down.
The Buffered Flag
Not every event happens while your observer is active. Sometimes layout shifts or paint events fire before your code has a chance to listen. That’s where the buffered flag comes in. This flag tells the browser to include recent past entries along with future ones. It only works for entry types that support buffering. Paint, layout shift, long task, largest contentful paint, and a few others all support it.
Here’s an example that compares buffered and non-buffered observers:
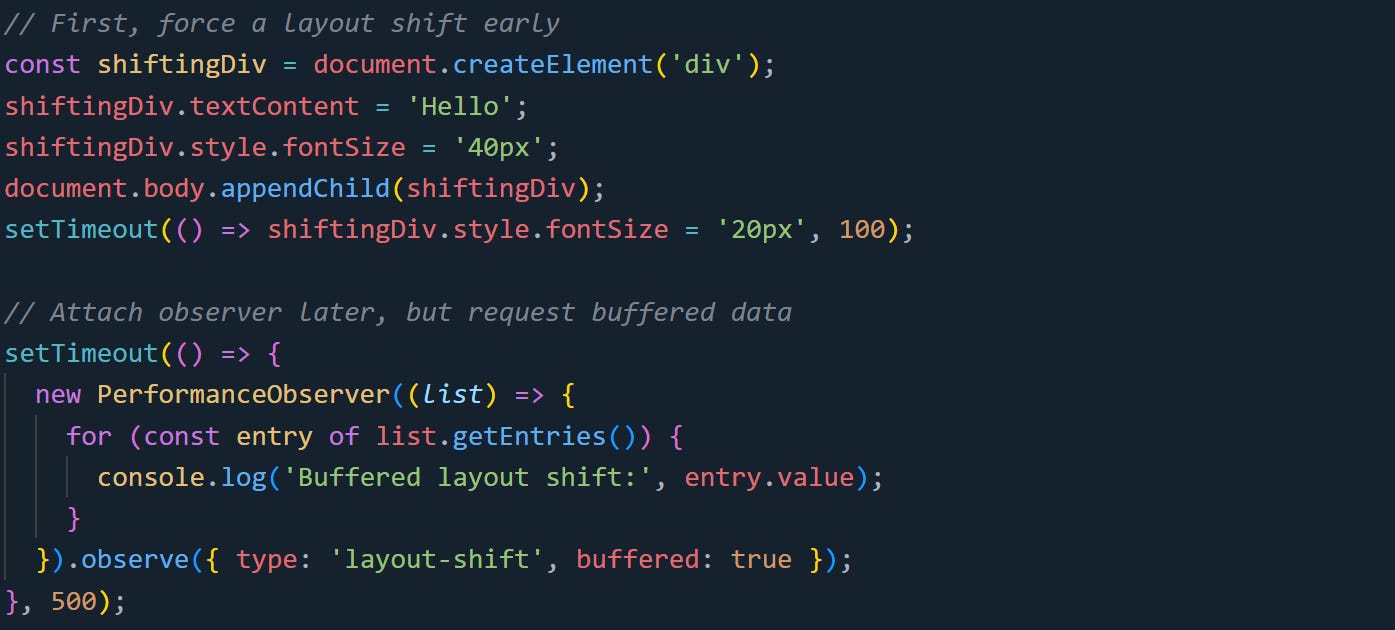
Even though the observer starts after the layout shift, it still receives the data. That’s only possible because of the buffered option.
Without it, the observer would miss anything that happened earlier. This becomes useful when loading scripts dynamically, running observers in response to user interaction, or waiting for an idle period before setting up measurement.
Lifecycle and Cleanup
An observer stays active until you tell it to stop. This is fine for one-time measurements, but if you’re tracking performance during page interactions or inside a framework component, you’ll want to clean up when you’re done.
You can disconnect an observer using the disconnect() method. That cancels all active subscriptions for that observer.
Another tool you can use is takeRecords(). It gives you any pending entries that haven't been delivered yet. It doesn't wait for the next callback cycle. This is nice if you're shutting things down and want to grab the last bit of data.

Both of these methods are safe to call at any time. They don’t interfere with other observers or the browser’s tracking system. Frameworks like React, Vue, or Svelte typically run cleanup code during unmount or teardown phases. Disconnecting observers inside those hooks keeps memory usage tight and avoids leaks, especially if you’re watching layout or input behavior inside reusable components.
Security and Privacy
Not all performance data is available in every context. Such as, if you embed third-party content in an iframe, the parent page won’t have access to detailed timing data about that content unless the iframe explicitly allows it. This is where the Timing-Allow-Origin header comes into play. Without it, the browser strips out most of the sensitive fields from resource timing and long task entries. It still shows that something happened, but hides things like precise timing or URLs.
Here’s what a stripped-down entry would look like:
{
  name: "",
  entryType: "resource",
  startTime: 0,
  duration: 0,
  initiatorType: "",
  nextHopProtocol: ""
}
This protects users from scripts that try to measure timing differences across origins, which could reveal fingerprinting data or security tokens by accident.
To allow another origin to access full data, a server can send this header:
Timing-Allow-Origin: *or, more safely:
Timing-Allow-Origin: https://example.comThis lets performance entries from that resource retain their timing fields for observers running on the specified origin. Without the header, the browser hides anything that could expose timing side channels.
Also, certain types like layout-shift and longtask are limited to the top-level browsing context. This means if your script is running inside a sandboxed iframe, some metrics may not appear or may show up in reduced form.
Conclusion
Tracking web vitals with PerformanceObserver gives you a direct line into how the browser schedules and records work. It hooks into the same system the browser already uses to manage rendering, layout, and scripting. You’re not adding overhead or guessing about performance. You’re listening to the actual timeline of events as they happen. With the right entry types and a bit of filtering, you can get real, reliable signals about how your site behaves in motion.